I recently attended the Johannesburg launch of the book “The age of menace” written by David Buckham, Robyn Wilkinson and Christiaan Staeuli. I bought the book and devoured it in a weekend. There were some cracking chapters dealing with Microsoft’s and Amazon’s market dominance, Facebook’s missteps, Sam Bankman-Fried, The Federal Reserve’s (the Fed) money printing experiments and the infamous Bill & Melinda Gate Foundation. I struggled to find the common theme amongst the 45 chapters in the book but perhaps that is because of my search for meaning rather than the authors’ faults. Despite this lack of thread, it was an absorbing read. I do hope they follow up with book 3 in the series (book 1 was “The end of money”).
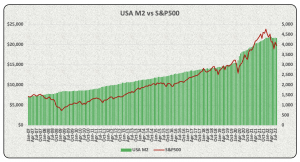
I decided to download the Fed’s monthly money supply (M2) data over the period 1970 to August 2022. I then compared this to the monthly movements in the S&P500 index (the stock market tracking index of 500 large listed USA companies) over the same period.
 The correlation between M2 money supply data and the movements in the S&P500 index over the ±52 year period was 97%. I know, I know, I know. You are taught at university that correlation does not equate to causation. But a 97% correlation is no coincidence.
Some interesting observations about the M2 money supply data:
- The Fed increased money supply from US$15.3 trillion In February 2020 to US$21.7 trillion in December 2021, presumably in response to Covid-19 lockdowns. That’s a 40.8% increase in money supply in the world’s largest economy. I am no economist but there has to be some consequences of the Fed’s actions? Perhaps an inflationary jolt to the USA economy? The Fed then steps in and raises interest rates to curb rising inflation, which in turn impacts on consumer spending and increases debt service costs of the government? We are currently seeing both occurring in the USA, with inflation rising from 1.5% in March 2020 to 7.7% in October 2022. Average USA 10-year government bond yields have increased from 0.9% in March 2020 to current 3.5%.
- The Fed started tightening money supply in January 2022 and what have we seen in 2022? Huge reverses in stock market gains, with the S&P500 down 9.7% so far in 2022.
I stumbled upon some interesting research performed by Hendrik Bessembinder of the W.P. Carey School of Business, Arizona State University and his fellow researchers (Te-Feng Chen, Goeun Choi and K.C. John Wei). Bessembinder analysed the long-run shareholder returns of over 64,000 global listed companies in 42 different countries over the period January 1990 to December 2022. The results were astonishing:
- Only 48.2% of the 64,000 odd listed companies produced a positive return for shareholders over the 30-year period;
- 57% of these companies failed to beat the USA one-month Treasury bill rate;
- The top 5 global companies by wealth creation accounted for 10.3% of the total increased shareholder value from 1990 to 2020; and
- 2.4% of the global companies researched accounted for all the net shareholder value creation (the remaining companies either produced negative returns or were immaterial in terms of wealth creation).
The top 10 wealth creators are hardly surprising.

As referred to in my pervious blog post, 2022 has been a rollercoaster ride on global stock markets. The above table would need to be adjusted for the events of 2021 and 2022. Apple, Microsoft and Alphabet (Google’s holding company) have held up pretty well but Amazon, Facebook and Tencent have got clobbered. Amazon’s market capitalization is down to US$960 billion and Tencent’s has retreated to US$378 billion in early December 2022.
The countries that produced the most wealth per company were Switzerland (US$5.3 billion on average), the Netherlands, Saudi Arabia, USA and Denmark. South Africa was way down the list in 30th place. Japanese companies, on average, managed to destroy US$557 million on average but that’s probably due to their banking crisis in the 1990s. You can review the detailed research results here Bessembinder 2020 global research should you be interested.
So what are the takeouts from Bessembinder’s research?
- Overall stock market returns are highly skewed – a few companies produce fantastic returns and the remainder have mostly average to negative returns
- A strong case for passive investing (invest in index tracking funds with a bit of speculation in individual stocks, but please not in bitcoin)?
- The asset management industry may be at significant risk of disruption?
Happy holidays and all the best from BeechieB.

Leave a Reply