Author: Beechie B (Page 1 of 4)

BeechieB is an accidental finance academic, corporate finance consultant and valuations expert. He reads widely and often, some fiction (favourite authors are Douglas Kennedy and Joseph Finder) and lots of non-fiction. Other than that Greg plays online bridge tournaments daily against robots and plays a lot of golf (many strokes and often).

Would you invest in SA Rugby?

The proposed sale of a 20% shareholding in a new entity to be created to hold the commercial rights and interests of the South African Rugby Union (SARU) to an obscure USA private equity outfit called Ackerley Sports Group (ASG) has elicited major criticism by some.  The meeting to vote on the deal was scheduled for 17 October 2024 but has been postponed to December 2024 amidst backlash from inter alia, the Bulls, Sharks , Golden Lions and the Stormers franchises, the Minister of Sport, Arts & Culture, the Honorable Mr. Gayton McKenzie, and SARU’s major broadcast partner, Supersport. Imagine constructing a deal that pisses off your major partners being the RSA  unions participating in the United Rugby Championship and Supersport? This could be a fascinating ‘business school’ case study how not to do a deal.

For those who have not read and/or reviewed the proposed SARU/ASG deal, as leaked by Business Day on 14 October 2024, the key elements of this imaginative corporate action include :

  • A new company, SARU Commercial Rights Company (CRC), will be formed to own all the commercial rights of SARU including the invaluable Springbok brand
  • SARU and ASG will own 80% and 20% equity interests in CRC respectively
  • Upon closing of the deal, ASG will advance a $35 million loan to CRC
  • ASG undertakes to advance a further loan tranche of $15 million 18 months after deal closing
  • ASG undertakes to advance final two tranches of $15 million and $10 million in 18 month intervals after the first $15 million advance but subject to undisclosed performance metrics
  • The board of directors of CRC will consist of 7 directors of which ASG and SARU will each be entitled to appoint 3 directors. An independent chairperson will be appointed by ASG [sic]
  • 90% of the net cash flows generated by CRC will be first applied to repaying ASG’s loan account together with 8% compound interest
  • Once ASG’s loan (and interest) has been fully repaid, SARU and ASG will each presumably share in 80% and 20% respectively of the dividends declared by CRC

An interesting aspect of the above deal structure is the scheduled loan repayments to and loan advances by ASG. The leaked PowerPoint presentation included forecast cash flows to and from ASG.

So ASG could be funding some of its loan advances using the proceeds of loan repayments from CRC – excellent negotiating and structuring by ASG. Private equity players, take note of this innovative investment structure, it could make you billions using other peoples’ money.

Tiisetso Motsoeneng, writing in the Business Day on 22 October 2024, launched into a scathing attack on the proposed SARU/ASG deal. Inter alia, Motsoeneng alleges that “…the valuation of the Springbok’s commercial rights at $375 million is a glaring underestimation…”. He further criticizes the deal for giving up control over the Springbok brand and legacy.

The Sharks, Bulls, Golden Lions, Stormers, Cheetahs, Boland Rugby Union and the Griquas prepared and signed a 7 page letter detailing their objections to the proposed ASG deal. There were compelling arguments against the deal and they questioned the potential value add of ASG. The proposed transaction fee payable of $7.5 million to Eddie Jordan, erstwhile F1 racing driver, also elicited a strong rebuke. What value could a transaction adviser add to justify a 10% transaction fee?  PS note to self, next time I bid for a corporate finance mandate, refer to Jordan’s 10% fee structure in justification for my paltry 5% success fee.

I decided to trawl through SARU’s annual reports for the years ended December 2019 through to December 2023. I expected to find some trauma relating to the COVID-19 pandemic lockdowns. Turns out, SARU encounters drama most years, battling to breakeven and not incur operating losses. Mark Alexander, the SARU chairperson, in the FY2023 annual report refers to the malaise facing SARU stating “…at the onset of 2023, our organization was confronted with a budget shortfall of R254 million, a direct consequence of the enduring impacts of the pandemic, our departure from Super Rugby, and our strategic investments in the north to preserve the professional game at home…”.

My analysis of SARU’s financial performance and position over the period FY2019 to FY2023 is included in the attached Excel spreadsheet. SA Rugby Analysis (October 2024). SARU managed to pull off miracles in FY2021 when the British & Irish Lions tour (without spectators) managed to generate R396 million in revenue for SARU. In FY2023, SARU managed to increase its grant income from World Rugby from R36 million in FY2022 to R291 million in FY2023. Without these two windfalls, SARU may have had serious going concern issues.

Frankly, having reviewed SARU’s historical financial performance, I would not invest my own money in SARU. The organization has reported operating losses in the past two years and pressures seem ongoing. Any business is only worth what it can produce in profits and free cash flows in the future. In SARU’s case, I applaud the executive for finding a private equity fund who is prepared to value the commercial rights of SARU at circa $375 million. Perhaps that’s why the deal structure was so overwhelming structured in favor of ASG?

Perhaps the debate should be whether SARU should be a capitalistic entity seeking to  maximize profits for its shareholders or it should be a non-for-profit organization?  The proposed CRC aiming to generate increasing profits and cash flows for ASG and SARU seems fraught with agency costs and conflicts of interests?


Some wisdom from Roger Federer

I was eagerly watching the Wimbledon mens final this past Sunday (14 July 2024) and cheering on Carlos Alcaraz  – I am not a Djokovic fan. I am not sure what it is about Novak that irks me, perhaps I should ask many of the Wimbledon fans who seem to take a similar stance. While watching the tennis I recalled Roger Federer’s recent Commencement Address at Dartmouth College. Roger said in his speech that he had won ±80% of the matches he had played in professionally but had only won 54% of all the points he had played.  That’s seems absurdly low but true. Roger continued…

“…When you’re playing a point, it has to be the most important thing in the world and it is. But when it is behind you, it’s behind you. This mindset is crucial because it frees you to fully commit to the next point and the next point after that with intensity, clarity and focus…You want to become a master at overcoming hard moments. That is to me the sign of a champion. The best in the world are not the best because they win every point. It’s because they lose again and again and have learnt how to deal with it….”

Profound words indeed.

Intrigued, I downloaded some statistics on Federer, Djokovic and Nadal’s record in major finals. Federer appeared in 31 finals and won 20 of those, a 65% win record. Djokovic leads the pack, appearing in 37 finals and winning 24 titles, also a 65% win record. Nadal, well he is just the ultimate warrior, winning all 14 French Open finals that he has played in and 8 other major titles.

Federer, Nadal and Djokovic have won a combined 66 major titles since 2003 out of a possible 84 titles over that period – that is incredible dominance given that Nadal first won the French Open in 2005 aged 19 years and Njokovic won his first major in 2008.

Federer won every single match in the first ten major finals he played in. Then Nadal and Djokovic ruined those stats. Djokovic beat Federer in 4 out of the 5 finals they played in. Similarly, Nadal beat Federer in 67% of the final matches they played against each other. The average number of games won in their major final matches makes for interesting reading.

Federer clearly did not go down without a fight.

Deon Gouws, the chief investment officer of Credo, a London based wealth management business, mentioned Federer’s comments about losing 54% of the time in his opinion piece in the Financial Mail (11 July 2024). Gouws related this to equity markets stating the equity indices generally go up 50% of the time and down on the other days. Needing no incentive to download data and model in Excel, I proceeded to check Gouws’ assertion. He was not far off – it transpires that the S&P500 (index of the largest 500 listed companies in the USA) had a positive daily return 53% of the time from January 1971 to June 2024. On 47% of the 13,489 trading days in that period the S&P500 declined. Good luck with predicting what will happen tomorrow but over the long run, it will “even stevens”.

The All Share Index of the JSE (ALSI) followed an identical trend, up 53% of the time on a daily basis. I analyzed the ALSI over the period January 2000 to June 2024 (5,015 trading days) – refer attached for Excel file ALSI TopBottom 25 days (June 2024) Pondering about whether it is better to stay invested all the time or try to guess whether the market will go up or down is an interesting conundrum. If you had invested in the ALSI in January 2000 and held onto the index until June 2024, your annual compound return would have been 10.9% excluding dividends. Certainly, a positive real return (after inflation) however, not as enticing as investing in Nvidia.

If hypothetically you had Nostradamus’ foresight, and could predict which would be the 25 worst trading days on the overall JSE and the 25 best days, what could your returns have been? In other words, you had the foresight to disinvest out of the ALSI a day ahead of each one of the 25 worst trading days over the period January 2000 too June 2024 and then reinvest a day after the “blood bath”, your compound annual returns would have 24.2%. If you lacked that foresight and instead divested ahead of the best 25 trading days on the ALSI, and then reinvested a day later, your compound annual returns would have dwindled to 4.0%.

Einstein apparently said that compound interest is the 8th wonder of the world. As mentioned above, the ALSI return over ±24 odd years has been ±10.9% excluding dividends. Investing R1,000 back in January 2000 would translate into ±R7,878 today. If you missed the 25 worst trading days over that period, your R1,000 would have grown to R76,204. If you had missed the 25 best trading days, your initial investment would have limped in at R2,199 in June 2024. What’s the lesson here? Perhaps ask your financial advisor.

Stay safe, be warm and all the best from BeechieB.

Please print some more money, my investment portfolio is shrinking…

I recently attended the Johannesburg launch of the book “The age of menace” written by David Buckham, Robyn Wilkinson and Christiaan Staeuli. I bought the book and devoured it in a weekend. There were some cracking chapters dealing with Microsoft’s and Amazon’s market dominance, Facebook’s missteps, Sam Bankman-Fried, The Federal Reserve’s (the Fed) money printing experiments and the infamous Bill & Melinda Gate Foundation. I struggled to find the common theme amongst the 45 chapters in the book but perhaps that is because of my search for meaning rather than the authors’ faults. Despite this lack of thread, it was an absorbing read. I do hope they follow up with book 3 in the series (book 1 was “The end of money”).

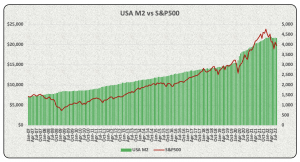
I decided to download the Fed’s monthly money supply (M2) data over the period 1970 to August 2022. I then compared this to the monthly movements in the S&P500 index (the stock market tracking index of 500 large listed USA companies) over the same period.

The correlation between M2 money supply data and the movements in the S&P500 index over the ±52 year period was 97%. I know, I know, I know. You are taught at university that correlation does not equate to causation. But a 97% correlation is no coincidence.
Some interesting observations about the M2 money supply data:

  • The Fed increased money supply from US$15.3 trillion In February 2020 to US$21.7 trillion in December 2021, presumably in response to Covid-19 lockdowns. That’s a 40.8% increase in money supply in the world’s largest economy. I am no economist but there has to be some consequences of the Fed’s actions? Perhaps an inflationary jolt to the USA economy? The Fed then steps in and raises interest rates to curb rising inflation, which in turn impacts on consumer spending and increases debt service costs of the government? We are currently seeing both occurring in the USA, with inflation rising from 1.5% in March 2020 to 7.7% in October 2022. Average USA 10-year government bond yields have increased from 0.9% in March 2020 to current 3.5%.
  • The Fed started tightening money supply in January 2022 and what have we seen in 2022? Huge reverses in stock market gains, with the S&P500 down 9.7% so far in 2022.

I stumbled upon some interesting research performed by Hendrik Bessembinder of the W.P. Carey School of Business, Arizona State University and his fellow researchers (Te-Feng Chen, Goeun Choi and K.C. John Wei). Bessembinder analysed the long-run shareholder returns of over 64,000 global listed companies in 42 different countries over the period January 1990 to December 2022. The results were astonishing:

  • Only 48.2% of the 64,000 odd listed companies produced a positive return for shareholders over the 30-year period;
  • 57% of these companies failed to beat the USA one-month Treasury bill rate;
  • The top 5 global companies by wealth creation accounted for 10.3% of the total increased shareholder value from 1990 to 2020; and
  • 2.4% of the global companies researched accounted for all the net shareholder value creation (the remaining companies either produced negative returns or were immaterial in terms of wealth creation).

The top 10 wealth creators are hardly surprising.

As referred to in my pervious blog post, 2022 has been a rollercoaster ride on global stock markets. The above table would need to be adjusted for the events of 2021 and 2022. Apple, Microsoft and Alphabet (Google’s holding company) have held up pretty well but Amazon, Facebook and Tencent have got clobbered. Amazon’s market capitalization is down to US$960 billion and Tencent’s has retreated to US$378 billion in early December 2022.

The countries that produced the most wealth per company were Switzerland (US$5.3 billion on average), the Netherlands, Saudi Arabia, USA and Denmark. South Africa was way down the list in 30th place. Japanese companies, on average, managed to destroy US$557 million on average but that’s probably due to their banking crisis in the 1990s. You can review the detailed research results here Bessembinder 2020 global research should you be interested.

So what are the takeouts from Bessembinder’s research?

  • Overall stock market returns are highly skewed – a few companies produce fantastic returns and the remainder have mostly average to negative returns
  • A strong case for passive investing (invest in index tracking funds with a bit of speculation in individual stocks, but please not in bitcoin)?
  • The asset management industry may be at significant risk of disruption?

Happy holidays and all the best from BeechieB.

Billions, trillions whatever, it’s only money

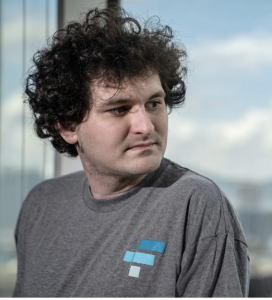
I loved watching the TV series Billions which had as its main character Bobby Axelrod, a hedge fund manager with questionable morals. Insider trading was the norm in Billions and many other misdemeanors were perpetrated. I believe season 7 is coming soon, can’t wait. Talking about billionaires, recognize this dude below?

The dude’s name is Sam Bankman-Fried (pronounced “Freed” and not like Kentucky “fried” chicken), a 30 year old who founded and controlled a cryptocurrency exchange called FTX. He was also CEO of Alameda Research, a quantitative cryptocurrency trading firm. FTX filed for bankruptcy on 11/11/22 (a rather symmetrical date). Forbes has estimated Bankman-Fried (SBF) was once worth US$32 billion but earlier today reported that he only had US$100,000 left in the bank. Hard to believe that, I am sure that he has many millions hidden away in offshore tax friendly jurisdictions.  SBF’s parents are both law professors at Stanford University. His father is also a clinical psychologist who specializes in treating young adults suffering from anxiety and depression. I am sure Professor Bankman-Fried will have some comforting words for his son. SBF’s mother is reportedly a tax expert, and focuses on moral philosophy and distributive justice. I had to google the last term, never heard of it before today. Mrs Google tells me that “distributive justice” is about socially just allocation of resources. I am surprised the ANC has not cottoned onto “distributive justice” but give them time. Their last election slogan “building better communities together” did not translate into reality with load shedding, crumbling water infrastructure and sewerage flowing into rivers and oceans. I digress.
It has been a year like no other in recent history on stock markets. There have been some unbelievable gyrations in share prices and market capitalizations. Market darling, Amazon, has endured some pain and suffering in 2022. Or shall I say, its shareholders have seen value evaporate faster than the morning mist in the Kalahari desert. Amazon had a cracking time in financial year (FY) 2020 and 2021 as we spent more time online than in shopping malls. Amazon’s revenue (excluding that from Amazon Web Services) went from US$245 billion in FY2019 to US$408 billion in FY2021. Amazon reported a rather pedestrian 6.0% increase in revenue for the 3 months ended 31 December 2021 as compared to the comparable period in FY2020. What do you think the stock market’s reaction was? I would have expected some weakness in Amazon’s share price. The results were announced on 3 February 2022. The next day Amazon’s share price jumped by 13.5%. That created a new record of an increase in market capitalization of US$191 billion in one day. Take that online shopping fanatics.

Amazon also became the first listed company in history to lose more than 1 trillion US dollars in market capitalization in a year. Its market capitalization peaked at US$1.89 trillion in July 2021. By 9 November 2022 the share price had plunged to US$86.14, wiping just over US$1 trillion dollars of shareholder value. This is probably due to Amazon’s poor financial results recently as its core platform incurred losses of US$8.1 billion in 2022 so far. Amazon is blaming higher shipping costs and inflation for its woes.

Talking about calamities, how about Meta Platform’s (aka Facebook) share price over the past year? Meta’s market capitalization has declined by over US$600 billion over the past year. It set a new record of a US$232 billion decline in value on 3 February 2022 after it released its annual results for FY2021. The stock market was seriously unimpressed, particularly with Meta’s obsessive focus on virtual reality and augmented reality. The Reality Labs division is focusing on the metaverse, a virtual reality world where one can interact with family and friends. Meta is betting the house on this technology platform, spending significant amounts on creating and enhancing its virtual reality centered metaverse. The Reality Labs division has incurred a cumulative operating loss of US$21.7 billion over the past two years. The stock market is not convinced about this strategic move.

Meta’s fortunes were also not helped by Apple’s move to improve user privacy. Apple now requires apps to ask users for permission before tracking them across other apps and websites. Meta announced in February 2022 that Apple’s increased privacy settings may reduce Facebook’s revenue by US$10 billion annually. Good on you Apple, I am growing increasing disenchanted with Facebook and its tracking of my internet activities. I recently did some research on a USA listed biotech company. Lo and behold, the next time I logged onto Facebook, there was an advert about the self same aforementioned biotech company. Eish.

Take care out there and all the best from BeechieB.

PS I will be posting again soon dealing with US money supply and fascinating stock market research I recently stumbled upon.


Pfizer vaccine part 2 – let’s connect the dots

Reading the Pfizer annual reports and browsing their website triggered my curiosity about the links between Pfizer, BioNTech and the Bill & Melinda Gates Foundation (BMGF). Dr. Susan Desmond-Hellman, a Pfizer non-executive director, proved to be an important link between Pfizer and BMGF. She was president of Product Development at Genentech between 2005 and 2009. Genetech is a biotech company owned by Roche which seeks to discover and develop groundbreaking medicines for life threatening diseases. Dr. Desmond-Hellman subsequently became CEO of BMGF until 2020 when she stepped down to join the Pfizer board.

BioNTech is a German based biotechnology group which focuses on developing immunotherapies for cancer and other diseases. It was founded in 2008 by the husband and wife team of Professor Ugur Sahin and Dr. Ozlem Tureci and backed by the Strugmann brothers. The latter are serial entrepreneurs who have built and sold numerous pharmaceutical companies and made billions in the process.

BioNTech is Pfizer’s partner in developing the COVID-19 vaccines, each party receives 50% of this vaccine’s revenues. BioNTech had been working on various mRNA therapeutics for years and had a relationship with Pfizer since 2018, developing a flu vaccine for them. Pfizer and BioNTech started working on a COVID-19 vaccine in January 2020, way before us mere mortals knew about a once in a lifetime pandemic. By April 2020, Pfizer had agreed to fund 100% of the development costs of the BNT162 vaccine program to prevent COVID-19. Pfizer astonishingly committed up to US$748 million to this vaccine development whilst BioNTech had no liability to contribute or repay any of the funding in the event that the vaccine was unsuccessful. If the vaccine was successful, BioNTech agreed to repay 50% of the development costs out of its share of vaccine revenues. Pfizer initially paid US$185 million to BioNTech which included subscribing for BioNTech shares to the value of US$113 million. Those shares are currently worth US$326 million, not a bad return over two years.

BioNTech’s major shareholders are the Strugmann brothers through their investment vehicle AT Impf GmbH (47.3%) and Professor Ugur Sahin (17.3%). BioNTech shareholders have been very patient, watching the company clock up significant losses over the years but their patience has been rewarded with BioNTech’s current market capitalization of US$33 billion on Nasdaq.

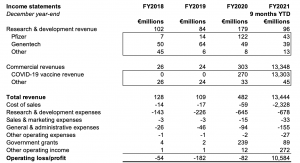
Reviewing the above table, a couple of things may be evident:

  • The majority of BioNTech’s revenue pre 2021 (December year-end) was derived from Pfizer and Genentech
  • The German government advanced €239 million in 2020 and €89 million in 2021 to BioNTech to develop a COVID-19 vaccine
  • BioNTech is due to release its audited results for FY2021 on 30 March 2022. Year-to-date operating profit for the 9 months ended 30 September 2021 was €10.6 billion, a massive turnaround from losses in prior years

The stock market is clearly skeptical about the sustainability of BioNTech’s profitability. A market capitalization of US$33 billion versus operating profit of US$11.6 billion? Seems a very low earnings multiple.

BMGF entered into an agreement with BioNTech in August 2019 for them to develop immunotherapies for the prevention and treatment of HIV, TB and infectious diseases. To seal their relationship, BMGF acquired ±3 million BioNTech shares for US$55 million. So the circle is complete, ex BMGF CEO (having previously worked with Genentech) joins Pfizer board in 2020, BioNTech collaborates with Pfizer to develop a COVID-19 vaccine in less than a year, BioNTech is in cahoots with BMGF and Genentech. Happenstance?

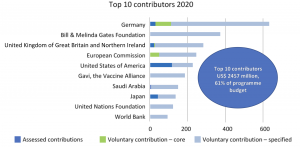
I suddenly remembered that BMGF was the second largest contributor to the WHO in 2020. How eerie is that?

I tend to avoid conspiracy theories, but I am left wondering about BMGF’s involvement with all these COVID-19 role players. Are you aware that the John Hopkins Center for Health Security, in partnership with the World Economic Forum and BMGF, hosted a high-level simulation exercise for pandemic preparedness and response in New York on 18 October 2019? Too many coincidences me thinks.

Stay safe and all the best from BeechieB.

Pfizer part 1, let’s look at the numbers

I am a numbers man. I love scrolling through annual reports and analyzing the financial performance of companies, from Apple Inc. to my clients. USA annual reports are so much easier to analyze since they don’t follow all these incredibly complicated international financial reporting standards (IFRS). Those rules are going to be the death of the chartered accounting and auditing professions! Apple Inc. has a September year-end and in 2021 it managed to release its audited results by 28 October 2021. Can you South African accountants and auditors imagine that? Anyway, I have been waiting for Pfizer’s 2021 annual report (December year-end) to jump into their numbers. Most of you would have heard of Pfizer. They are those guys who have been manufacturing and selling a whole bunch of drugs since 1849 and famously little gems like Viagra. They also produced and sold 2.2 billion COVID-19 vaccines in 2021.

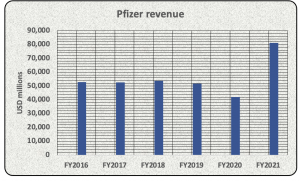
I downloaded their annual and financial reports for the financial years (FY) ended 31 December 2016 through FY2021. What a treasure trove of information these contained. Pfizer’s total revenue had been stagnating until FY2021. These pharmaceutical giants like doing deals, buying and selling companies and acting as if their main business is mergers & acquisitions. Perhaps Pfizer had been selling more than buying recently? And then came the COVID bonanza.

Pfizer, in collaboration with BioNTech, started jointly developing a vaccine to save us from COVID-19 in January 2020. They obviously knew something the rest of us didn’t since the WHO only declared a global pandemic on 12 March 2020. Pfizer worked at lightening speed and managed to get the Food and Drug Administration’s (FDA’s) approval for the emergency use of their Comirnaty vaccine in December 2020. What a boon that proved to be as their COVID-19 vaccine sales of USD36.8 billion represented 45% of their total revenue in FY2021.

The above chart depicts Pfizer’s stagnating revenue until FY2021. Revenue in FY2020 was USD41.9 billion, in 2021 it increased by 94%. Not too shabby at all. And there is more good news to come since management are forecasting to produce 4 billion COVID-19 vaccines in 2022. They also have a new oral COVID medication called Paxlovid coming onto the market, having received FDA emergency use approval in December 2021. December seems to be a very good month for them. Management are optimistic that Paxlovid will deliver USD22 billion of revenue for the group in FY2022.
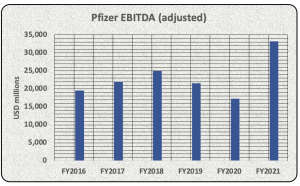
I have analyzed Pfizer’s financial performance in some detail – here is the link to my Excel spreadsheet Pfizer analysis (Feb 2022). For those of you who have never inspected these pharmaceutical companies’ financial results, their margins are staggering. Pfizer’s average gross profit margin for the 5 years prior to FY2021 was 78.8%. In layman’s terms that means manufacturing a drug for USD21.2 and then selling it for USD100. These groups claim that they incur significant research & development expenditure to develop, patent and then get products to market and hence, the need for high margins. Um well, they still consistently make enormous profits. Refer below for Pfizer’s earnings before interest, taxation, depreciation and amortization (EBITDA) for the past 6 years.

Eish, that’s an average EBITDA/revenue margin of 41.6% over the past 6 years. Sounds like a good business to be in.

Pfizer has some concentration risks – two of its vaccines (Comirnaty and Prevnar) represented 52% of total revenue in FY2021 and its top 10 products made up a staggering 76% of sales. At any good business school, they would teach you that over-reliance on too few products or customers may be a very bad thing. Apple Inc. has ignored that advice for years as its iPhone sales have consistently represented more that 50% of total revenue.

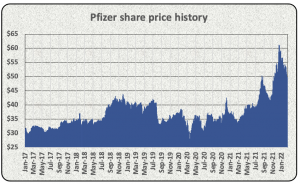
The stock market’s rating of Pfizer has been interesting. Its share price was USD36.81 at 31 December 2020 and increased to USD59.05 a year later. That’s a tidy 60% return. It has since retreated to USD48.65 as of 4 March 2021.

There is all sorts of speculation about the efficacy and side effects of the Pfizer vaccine, so expect share price volatility for a while. But with significant growth in revenue and profits expected in FY2022, it should be smelling like all roses?

As an aside, Dr. Susan Desmond-Hellman, is a non-executive director of Pfizer. She was the Chief Executive Officer of the Bill & Melinda Gates Foundation from 2014 to 2020, and remains a senior advisor and board member of the Foundation. She joined the Pfizer board in 2020, so coincidental. She has also been a non-executive director of Facebook (2013 to 2019) and Proctor & Gamble (2010 to 2017). So, Dr Desmond-Hellman has experienced some interesting times in corporate America.

A follow up blog post will be out later next week. Be safe and take care. We live in interesting times. All the best from BeechieB.


Tesla, the economic miracle and its errant CEO

I recently read “Power play: Elon Musk, Tesla and the bet of the country” written by Tim Higgins. It provided fascinating insights into the history and rise of Tesla. It also contained some rather juicy tidbits about Elon Musk and his management style. Musk has distanced himself from the contents of the aforementioned book and when asked for comments by the author he simply stated “..most, but not all, of what you read in this book is nonsense…”. A strong rebuke indeed.

Musk is by all accounts an interesting character. He grew up in South Africa and matriculated from Pretoria Boys High School in 1988. He apparently spent 5 months at the University of Pretoria before traveling to Canada, his mother’s homeland. He was reportedly a coding genius in his teens and subsequently started a a software company in 1995 which was later sold to Compaq for US$307 million in 1999. Musk was also a key shareholder in PayPal, which was sold to eBay in 2002 for US1.5 billion. It follows that he had plenty of capital which allowed him to pursue opportunities such as SpaceX, Tesla and SolarCity (subsequently acquired by Tesla). Forbes reported on 23 November 2021 that Musk was the world’s richest person with an estimated net worth of US$295 billion. Not bad for a boykie from Pretoria.

I follow Elon on Twitter and he can’t stop himself from tweeting some outrageous stuff at times. In July 2018, he offered to provide a submarine to be used to rescue those Thai teenage soccer players trapped in a cave. Vernon Unsworth, an experienced cave diver, took issue with Musk stating that “…Musk’s submarine had no chance of working, its just a PR stunt…”. This sparked a Twitter war with Musk eventually losing his cool and calling Unsworth a pedo.

Tesla’s share price has increased from US$86 at the start of 2020 to US$1,145 at the end of November 2021, a staggering annualized return of 287% over that period. Tesla manufactured and sold 25,202 electric vehicles in 2015. In the 2020 financial year, it managed to increase deliveries to just under 500,000 vehicles. In the nine months ended 30 September 2021, that number increased to 627,572. Until 2020, Tesla had incurred operating losses as it failed to generate sufficient revenue to cover research & development expenditure and operating costs. That changed dramatically in 2020 when Tesla reported EBITDA (earnings before interest, depreciation, amortization and taxation) of US$6 billion. No wonder the stock market richly rewarded Tesla shareholders with a dramatic rerating of the share.

I have analyzed Tesla’s financial performance for 2015 to 2020 – refer attached excel file   Tesla Financial Analysis (November 2021).  Despite all those operating losses, Tesla managed to survive the cash burn by borrowing more and more and also taking customer deposits for new vehicles ordered. It is a miracle that the group avoided bankruptcy. If lenders had lost confidence in Tesla’s ability to trade out of its predicament, it would have been game over.

Unlike most automotive groups, Tesla sells directly to its customers bypassing third party dealerships. It sells vehicles through its website and its own retail locations. Tesla also has its own vehicle service centers, mobile service technicians and supercharger stations. Tesla vehicles’ software is often remotely and automatically updated, with occasional glitches. In November 2021, Tesla recalled ±12,000 vehicles because of a communication error that may cause a false forward collision warning or unexpected activation of the emergency brakes. Later in the same month, hundreds of Tesla drivers were locked out of their cars after the manufacturer’s mobile app suffered an outage. That would have been rather inconvenient if it happened on a road trip.

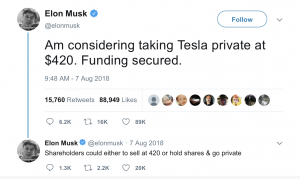
Getting back to Musk’s Twitter escapades, he tweeted about taking Tesla private in August 2018.

The US Securities Exchange Commission (SEC) filed a compliant against Musk and Tesla alleging that Musk had lied about securing funding for the buyout of Tesla. It is extraordinary for a CEO of a listed company to divulge his intentions about buying out other shareholders on social media. There are clear rules about listed companies and their executives communicating potential corporate actions since these are price sensitive matters. The buyout price of US$420 was alleged related to the infamous time that many marijuana smokers light up their first joint of the day. Anyway, Musk’s misdemeanour cost Tesla a US$20 million fine and Musk agreed to step down as chairman of the company but remained on as CEO.

This did not stop Musk having a dig at the SEC later in 2018, referring to it as the ‘Shortseller Enrichment Commission’.

Tesla’s market capitalization (total value of the group on the stock exchange) is currently US$1.15 trillion. The Volkswagen group’s market capitalization is currently US$112.5 billion, roughly 10 times smaller. This is despite the fact that the VW automotive division sold 9.2 million vehicles in 2020 compared to Tesla’s ±500,000. The VW automotive division’s profitability is also over 9 times larger than Tesla’s. Clearly, investors are expecting electric powered vehicles to be ubiquitous in the next decade. Eskom better sort out its nonsense before that happens in sunny South Africa.

Stay safe and all the best from BeechieB.

Let’s talk about executive remuneration

When the Johannesburg Stock Exchange (JSE) introduced the requirement for listed companies to disclose the remuneration of executive directors in the early 2000s, I was on record warning about the unintended consequences of this. I argued that by making executive pay public knowledge, the average remuneration of directors would generally rise as individuals demanded comparative pay to their peers. Previously, executive remuneration was not in the public domain and hence, it was difficult for executives to benchmark executive pay except anecdotally.

The Companies Amendment Bill of 2021 in South Africa proposes taking disclosure of executive remuneration a step further. It proposes the disclosure by state-owned and public companies of:

  • the total remuneration (guaranteed salary, benefits and other incentives) that has been paid to the highest paid employee and that of the lowest paid employee
  • the average and median remuneration of all employees
  • the gap, expressed as a ratio, between the top 5% highest paid employees and the bottom 5% lowest paid workers

The U.S. Securities and Exchange Commission (SEC) introduced similar disclosure requirements in 2015 for all listed USA companies. Their requirements are simpler requiring only the disclosure of what the CEO earns versus the median (mid-point in the data set) of all its employees except the CEO. The Marxist leanings of the ANC government is clearly evident in the Companies Amendment Bill 2021, requiring public and state-owned companies to publish what the highest and lowest paid employees earn, which will reveal a much worse pay gap than comparing the CEO’s paycheck to the median salary of all employees. I also venture to guess that the pay gap ratio at our bloated state-owned entities will be much lower than in the private sector.

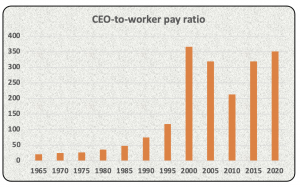
The Economic Policy Institute based in Washington D.C, recently published the CEO-to-worker compensation ratio (average remuneration of CEO versus the average worker in that firm’s industry). According to their calculations, CEOs earned 351 times more than the average pay packet of all employees. This ratio reached a peak in 2000 during the dot.com boom but 2020’s result, whilst in the midst of a pandemic, is near that peak.

As can be seen in the above chart, the CEO-to-worker pay ratio was ±20 times in 1965. It has increased steadily over time, which may be due to lucrative share incentive schemes which enrich the top executives rather than the masses.

McDonald’s CEO, Chris Kempczinski, earned a total of US$10.8 million in 2020 which was 1,189 times higher than the median salary (US$9,122) of McDonald’s employees. The pay ratio is calculated as CEO remuneration divided by the global median salary of McDonald’s workers. I would be guessing that a griller in Phuket, Thailand would not be earning the same as his/her counterpart in New York.

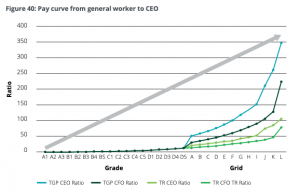
Deloitte in its September 2021 report, “Your guide: Director and prescribed officer remuneration at JSE listed companies”, reveals that the total guaranteed pay (TGP) of CEOs versus the general worker of JSE listed companies is similar to the USA experience. Magically, the ratio of 350 times in RSA is near damn it to the USA’s 351 times.


PS. Andre de Ruyter, the CEO of Eskom, earned R7.2 million in the year ended 31 March 2021, which was 9.5 times that of the average of all Eskom employees (±R748,626).

The Economic Policy Institute estimated that the average realized remuneration of CEOs of USA listed companies was US$24.2 million in 2020. That would imply that the average worker pay was ±US$69,000 in 2020. This is similar to the US Census Bureau’s published data of median household income of US68,703 in 2019. I have some sympathy for those who argue that executive compensation is generally too high relative to their actual inputs and versus the general worker. Imagine earning US$24.2 million a year (±R363 million) for barking orders and traveling business class and occasionally having to explain things at a board meeting?

PWC’s “Practices and remuneration trends report, August 2021”, reveals that the average pay packet of CEOs of JSE listed companies was R5.2 million in 2020 whilst the average CEO pay in the larger listed consumer goods companies was a whopping R38.7 million. It would appear that South African executives are significantly underpaid relative to their USA peers (dry humor intended, no offense meant).

I wonder what the intentions are behind forcing the disclosure of the highest paid employee versus the lowest paid, and the pay gap between the top 5% and bottom 5%? Well, the Companies Amendment Act Bill published on 1 October 2021, had some interesting statements in this regard:

“…Excessive remuneration particularly at the highest levels of a company is a matter of great concern internationally…”

“…The factors giving rise to these concerns are to an extent responsible for the significant levels of inequity in society…”

“…The amendments proposed in the Bill are also required to tackle the injustice of excessive pay. The pay gap has been a historical challenge and a contributor to the country’s inequality…”

“…Analysis of Statistics South Africa data in the annual Labour Market Dynamics survey shows that inequality in pay contributes as much to overall income inequality as joblessness…”

“…This kind of inequality underpins much of the well-known workplace conflict in South Africa…”

Ok, I get it. The reason for inequality and inequity in society is that executives are paid so much more than lowly workers. Our Minister of Trade, Industry and Competition, the notorious communist Ebrahim Patel, seems to think that the answer to South Africa’s dire unemployment and inequality problems are to simply force those capitalist pigs to disclose what they earn. Perhaps a better way of reducing income inequality would be to pay all workers the same irrespective of education, skill, know-how and experience levels? That would certainly solve the inequality problem. Furthermore, perhaps nationalizing everything would solve wealth inequality too since all of us except those communists at the top would have no assets. I am being facetious. There are some very clever economists and business people out there who could provide some solid suggestions to reducing unemployment and inequality. I don’t trust these ANC cadres and their advisors to solve anything. Rather I expect them to blame everyone else for destroying the South African economy and creating world leading unemployment levels.

If these disclosure rules are enforced, what do I think may transpire?

  • Public companies will continue to pay their executives millions, ignoring the bleating regulators;
  • Companies will find ingenious ways to hide elements of executive compensation;
  • Companies may embark on African and international expansion, limiting investment in South African operations;
  • The trade unions will demand higher wages for their members by highlighting the enormous pay gaps;
  • Companies may aggressively replace lower skilled and paid employees with robots and automation;
  • Companies may outsource more of their operations; and/or
  • Rising unemployment levels in South Africa.

Beware the unintended consequences of decisions

Have fun out there and celebrate the municipal election results. Service delivery is set to improve in certain areas. All the best from BeechieB.


Covid-19 fatigue

The Sunday Times recently reported that the Minister of Cooperative Governance and Traditional Affairs, Nkosazana Dlamini-Zuma (NDZ), presented a plan to the ANC’s national executive committee about building a new smart city on the Wild Coast. How bizarre, how bizarre. Where would the money come from to build such a city? Certainly not from the private sector. I would have thought NDZ and the rest of her command council members would have better things to do than to dream about pies in the sky. Perhaps someone senior in the ANC should remind NDZ that we are in the midst of a pandemic and that our expanded unemployment rate presently stands at a staggering 44.4%. Oops, I forgot, the ANC loves dreaming up mega projects such as building nuclear power stations, 20-year emergency electricity procurement from floating power plants and upgrading Prasa’s locomotive fleet. The playbook hardly varies and corruption abounds.

I bravely read Duma Gqubule’s opinion piece in the Business Day on 4 October 2021. His columns are somewhat unorthodox and he has some interesting proposals to solve South Africa’s many economic and social crises. His latest advice revolved around the proposed basic income grant (BIG):

“…In a paper that will be released soon I looked at eight scenarios for implementing a BIG and settled on one. This involves a three-year implementation of a debt-financed BIG for adults aged 18 to 59 at the upper poverty line of R1,335 a month, and extending it to children who currently get the child support grant, which is way below the food poverty line of R624 per month.

Assuming a 60% uptake and a clawback from taxpayers and after taking into account planned spending on the child support grant, the proposal would provide a R360bn stimulus to the economy over three years. This would eliminate poverty, result in an annual average GDP growth rate of 4.8% and create 3.7 million jobs…”

Oh my goodness, why didn’t anyone think of such an elegant solution to end poverty and reduce unemployment before? I am not an economist but I have seen the end results of such money printing adventures. Think Zimbabwe, think Venezuela.

I joined Twitter earlier this year after avoiding this social media platform like the plague for years. I was starting to doubt the integrity, objectivity and independence of certain mainstream media outlets so I thought it would be useful to gain insights from interesting people. Twitter has proved to be a treasure trove of information, disinformation and misinformation, and a platform to allow people to be rather nasty to each other. I ignore all the negative stuff and fact check often. I currently have three followers and my ego would love to reach 50 followers by year end, so please find me @GregBeech3. Talking about Twitter, the infamous Piers Morgan tweeted yesterday about a topic that should be avoided at all costs to preserve family harmony and retain friendships:

I have been avidly following Covid-19 death data globally since March 2020. Most of us have seen the destruction that the SARS-CoV-2 virus has wrought in our communities. I have lost an aunt to Covid-19 and some of my friends have landed up in ICU. This virus is deadly to some and I have been terrified by the excess deaths statistics published weekly by the South African Medical Research Council (SAMRC) on its website www.samrc.ac.za. Last time I checked, SAMRC estimated that over 260,000 more souls had passed than predicted over the period May 2020 to September 2021.

However, I have some gripes with SAMRC’s excess death reporting:

  • When publishing weekly excess death data, they remove the previous reports and Excel files. Hence, unless you download these reports weekly, you cannot access prior reports. I would have thought transparency and access to data would be paramount in the midst of a pandemic?
  • To my knowledge, SAMRC did not publish their actual weekly predicted natural deaths until May 2021. Previously, the public had to blindly believe SAMRC’s narrative about excess death data without access to the underlying benchmarks.
  • SAMRC treats negative excess deaths (less deaths than predicted) in any particular week as zero instead of subtracting these from the rolling total of excess deaths. Somewhat disingenuous if you ask me.
  • SAMRC had until August 2021 not included natural deaths (estimated and predicted deaths) of less than 1 year olds in its data sets. It now includes these in its estimate of excess deaths, thus making prior comparisons difficult.

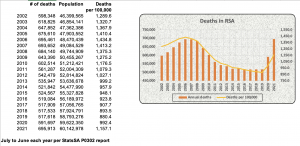
I resorted to Statistics South Africa’s (StatsSA) mid-year population estimates and death data in its PO302 reports to get another perspective on the potential extent of excess deaths in South Africa. These reports contain estimated deaths for periods commencing on 1 July and ending 30 June of the following year. I took the liberty of calculating the estimated deaths per 100,000 over the past 20 years and charting this.

The death data per capita for the year ended 30 June 2021 was concerning however, nowhere near as bad as 2006. That was the height of AIDS denialism by certain senior ANC cadres. HIV/AIDS remains a serious problem in South Africa. SAMRC in its National Cause-of-Death Validation Project report dated July 2020  refers to research that estimates that 29.1% of all deaths in 2012 in South Africa were HIV/AIDS related.

The ourworldindata.org website (OWID) contains huge amounts of Covid-19 data globally. I downloaded their 30 September 2021 Covid-19 Excel files and analysed annual death data of 60 odd countries for the 6 years from 2015 to 2020. I calculated average annual deaths per country for 2015-2019 and compared this to deaths in 2020. Higher deaths in 2020 compared to the average of the previous 5 years were regarded as excess deaths. No attempt was made to attribute excess deaths to Covid-19 but rather to consider excess deaths from all causes. Excess deaths in 2020 were expressed as a percentage of the average over prior 5 years. Refer attached for my Excel workings should this be of interest to you  Excess death estimates based on OWID data (Sept 2021). Interestingly, there was no death data for South Africa or China provided by OWID.

OWID also publishes lockdown stringency measures (between 0 and 100, with 100 being the harshest lockdown measures) per country per day. OWID also provides inter alia, median ages per country, vaccination statistics and diabetes prevalence.  My hypotheses were:

  1. Countries with the harshest lockdown measures for the period 12 March 2020 (pandemic declaration date) to 30 September 2021 would have the lowest excess death counts.
  2. Countries with the lowest median population age would have the lowest excess deaths based on the assumption that older people face higher mortality risk.

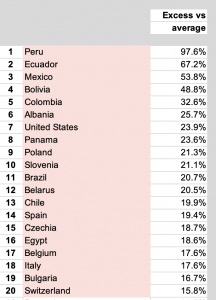
The results of my analysis had me confused. The 20 countries with the highest excess deaths were:

Certain South American countries were badly hit in terms of mortality in 2020. Peru had ±215 million deaths from all causes in 2020 compared to an average of 109 million in prior years. Mexico recorded 375 million more deaths in 2020 than in prior years whilst Brazil recorded an extra 271 million deaths. USA topped the list in terms of sheer numbers with an estimated 664 million higher deaths than normal.

Uruguay had ‘negative’ excess deaths in 2002. Australia and New Zealand emerged relatively unscathed in 2020 with 3,400 and ±500 excess deaths respectively in 2020 per my calculations.

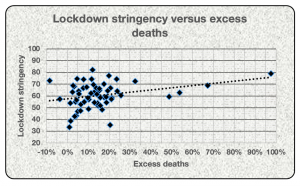
Returning to my first hypothesis, there was no clear pattern between lockdown stringencies and excess deaths.

I would need an actuary to advise on the correlation between excess deaths and lockdown stringencies in the 60 selected countries. I used Excel’s CORREL and RSQ functions to estimate the relationship between these datasets. It revealed a correlation of 0.30 between lockdown stringency and excess deaths, not a strong correlation at all. The RSQ function in Excel provides an estimated ‘measure of fit’ between two variables. A R-Squared score of 1.0 would essentially mean that excess deaths could be completely explained by lockdown measures. Conversely, a R-Squared score of 0.0 could be interpreted as lockdown measures having no impact on excess deaths. The actual R-Squared score between the datasets was calculated to be 0.09, meaning excess deaths were largely unexplained by lockdown measures.

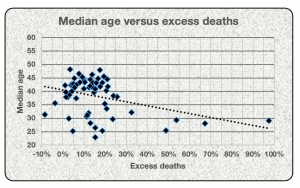
My second hypothesis was that countries with higher median ages would fare worse in terms of mortality than countries with younger populations.

The scattergraph above also reveals limited correlation between excess deaths and median ages. The CORREL function result was -0.36, which was a complete surprise. I interpret that as meaning that there was limited correlation between median ages and excess deaths, and if there was, it was negative (countries with younger populations tended to have worse excess death outcomes than countries with older populations). The R-Squared result for median age versus excess deaths was 0.13, revealing limited fit between the datasets.

I will leave to ponder on these apparent contradictions. Stay safe and all the best from BeechieB.


Three Questions

I have many questions rattling around my brain at any point in time. I am generally a curious person who likes to explore and go off on tangents in the search for knowledge and hopefully some wisdom. I would like to share three questions with you without necessarily answering these. If you have answers or comments, please share these on the blog post.

  1. Why is it that stock markets are so volatile?
  2. Why do South African citizens vote for the ANC?
  3. What is this asymptomatic transmission of SARS-CoV-2 all about?

Ok, let’s dive straight into the first question.

1. Why is it that stock markets are so volatile?

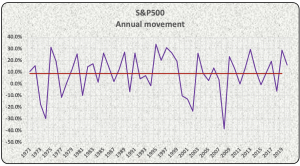
Stock markets, whether it be in Johannesburg or the USA, are incredibly volatile. Refer below for the annual movement in the S&P 500 index (the weighted stock market index of the largest 500 listed companies on all stock exchanges in the USA) over the period 1970 to the end of 2020. The average annual increase in the S&P 500 over the aforementioned period was 8.9%.

Some of you may not recall stock market movements in the 1970s, 1980s or even in the 1990s. 19 October 1987, sometimes referred to as ‘Black Monday’, was a day to remember. The S&P500 index dropped 20.5% in one day based on no new information in the markets. It was a panic attack of note. The S&P500 took strain in 2000, 2001 and 2002 declining by 10.1%, 13.0% and 23.4% respectively in these years. These were the years post the Dotcom bubble when most market pundits thought the world would fundamentally change due to the internet. Any company which had any remote possibility of doing business via the internet received ridiculous valuations. You may recall what happened in 2008 when the titans of Wall Street were caught with their pants down after packaging and selling subprime mortgage debt. Remarkably, 2020 was a good year on the S&P500 with the index rising 16.3% despite the mayhem caused by COVID-19 lockdowns. John Maynard Keynes famously said “…markets can remain irrational longer than you can remain solvent…”.

2. Why do South African citizens vote for the ANC?

Believe or not, Eskom had surplus electricity generation capacity in 1994. Now we are regularly load-shedded. South Africa’s public healthcare and education systems are broken. A fire at the Charlotte Maxeke hospital in Johannesburg in April 2021 resulted in a mass evacuation of its patients and staff. As of today, its 1,088 beds remain unoccupied in the midst of a pandemic. The Helen Joseph hospital in Auckland Park has had severe water shortages over the past week thanks to Joburg Water’s troubles at a nearby reservoir. Imagine a hospital without water? That means no surgeries, no flushing toilets, a germ fest and very thirsty patients.

South Africa’s public education system is dysfunctional. 78% of our grade 4 pupils cannot read for meaning per a recent international survey. Our unemployment rate amongst 15 to 24 year olds is 74%. Amongst all adults of working age, it is 42.6%, the worst in the world. Service delivery at municipal level is horrendous. Only 20 out of 257 municipalities nationally received an unqualified (without findings) audit reports from the Attorney General. The North West and Free State provinces had no unqualified audit reports at municipal level. KwaZulu-Natal only had 1 municipality receive an unqualified report out of 54 municipalities. The Attorney General reported that irregular expenditure at municipality level was R54 billion in 2019/2020. Shocking. Welcome to cadre deployment.

So why would any sane person vote for a political party that is fundamentally corrupt and unable to deliver basic services for the population in South Africa? Some of these ANC appointed public office bearers and their cronies, cousins, wives/husbands and friends are under investigation for COVID-19 PPE corruption amounting to R14 billion per the Special Investigating Unit. They just can’t stop themselves.

3. What is this asymptomatic transmission of SARS-CoV-2 all about?

There has been much debate about the reliability of PCR tests for SARS-CoV-2 and the ability of those who have tested positive to transmit the virus to others. Of those who test positive, some will develop COVID-19 (the disease) and display symptoms and others will have no symptoms (asymptomatic). Like with flu, it would make intuitive sense that symptomatic persons who have COVID-19 can spread the virus to others. Whether asymptomatic persons, who have returned a positive test for SARS-CoV-2, can spread the virus is less clear. Some esteemed scientists say categorically that asymptomatic spread is a major driver of COVID-19 infections. Others acknowledge that asymptomatic spread could occur but opine that it is highly unlikely to be a key driver in transmission of the virus. Even the World Health Organisation (WHO) is confused. On 8 June 2002, Dr Maria van Kerkhove, a senior WHO official, stated “…from the data we have, it still seems rare that a asymptomatic person actually transmits onwards to a secondary person…”. A day later she retracted her statements and indicated there was much that is unknown with regards to asymptomatic coronavirus spread. The WHO on its website in July 2020 stated that “…Yes, infected people can transmit the virus when they have symptoms and when they don’t have symptoms…”. All quite confusing really.

My question is how do scientists reach conclusions on symptomatic and asymptomatic transmission? If it was a controlled experiment in an old age home that was quarantined (all persons including care providers), it may be possible to track the transmission of the virus from symptomatic persons to others within the facility. However, if care providers are interacting with the outside world, how do you definitively know who infected who? This is particularly relevant if asymptomatic transmission occurs. Any number of people could have infected numerous others.

The question of asymptomatic transmission is of critical importance to public healthcare measures with regards to COVID-19. If asymptomatic transmission is rare then there would be no need for lockdowns and school closures. If asymptomatic transmission is a key driver of the virus spread, we are in a world of pain (health wise, economically and mentally).

I am comforted by two findings:

  • A research report “Household transmission of SARS-CoV-2; a systematic review and meta-analysis; Z. Madewell; Y. Yang and I. Longini” published in the Journal of the American Medical Association on 14 December 2020. The research covered 54 studies involving 77,758 participants and concluded that household secondary attack rates for symptomatic cases was 18.0% versus 0.7% for asymptomatic cases.
  • A report by Dr John Ioannidis, a professor at Stanford University, in the Bulletin of the WHO published on 14 October 2020, that concluded that the median infection fatality rate in 51 different locations globally from COVID-19 was 0.23%. He further stated “…COVID-19 has a very steep age gradient for risk of death…and in some cases most, deaths occurred in nursing homes…the infection fatality rate would still be low among non-elderly, non-debilitated people…”.

All the best from BeechieB. Be safe and do not fear too much.

« Older posts

© 2025

Theme by Anders NorenUp ↑